


WAREHOUSE PERFORMANCE MANAGEMENT
A warehouse can report more completed AGV forklift tasks without improving its overall throughput. To evaluate automation accurately, operations teams need consistent KPI definitions that separate vehicle performance from delays caused by unavailable pallets, storage constraints and downstream processes.
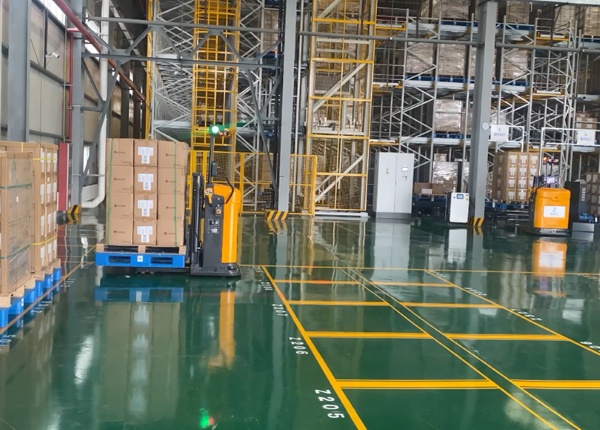
AGV forklift performance should be evaluated against the warehouse tasks the system is expected to complete. Vehicle speed, operating hours and total task counts provide useful information, but none of them alone explains whether the warehouse is moving pallets more reliably.
A high task count may reflect short movements rather than productive storage transfers. High vehicle utilization may indicate efficient operation—or excessive waiting with little opportunity to complete work. A low completion rate may originate from vehicle faults, but it may also result from pallets that are not ready or destinations that remain unavailable.
The solution is to define a small set of measurable indicators, establish how each is calculated and review the causes behind the results.
Completed pallet moves are an intuitive measure of output, but the counting rule must be consistent. Decide whether one task represents a single pickup-and-delivery transaction, a warehouse request or another defined unit of work.
Separate successfully completed tasks from canceled requests, duplicate requests and tasks that end in an exception. If a failed task is retried, specify whether the retry is recorded as another attempt or a new task. This prevents performance reports from counting repeated attempts as additional completed moves.
Report throughput over a defined time window, such as a shift or operating day. Where demand varies substantially, compare periods with similar working hours and task mix. Also track the number of eligible tasks released to the fleet so that low demand is not incorrectly interpreted as poor vehicle performance.
Overall task cycle time measures how long a transport task takes from a defined starting event to a confirmed completion event. The start and end points must be documented; otherwise, different reports may measure different processes.
For diagnosis, divide the cycle into useful stages:
Release-to-assignment: time between a valid task entering the queue and a vehicle being assigned.
Assignment-to-pickup: time spent before the vehicle collects the load.
Loaded travel and handling: time required to transport and place the pallet.
Completion confirmation: time needed for the physical movement and required system updates to be confirmed.
These stages reveal different problems. A long assignment delay may indicate a fleet capacity or dispatch issue. A long pickup wait may indicate that the pallet is not ready. A slow completion confirmation may point to a process or interface delay rather than a travel problem.
Vehicles can spend a meaningful part of their operating time waiting for a pallet, an available destination, access permission or another vehicle to clear a shared route.
Record waiting time by reason whenever the system can reliably identify the cause. Useful categories include pickup not ready, destination unavailable, route blocked, equipment interface waiting and authorized manual intervention.
Manual intervention should also be defined carefully. A planned operator action that is part of the approved workflow is not necessarily an exception. A manual recovery required because a task cannot proceed normally should be counted separately.
Review both the frequency of interventions and the time they consume. A small number of lengthy interventions may have a greater operational impact than many brief, routine confirmations.
Vehicle utilization can help explain how the fleet's available time is being used, but the definition must match the intended decision.
For example, the warehouse may separately measure time spent transporting a load, traveling without a load, waiting, charging, undergoing maintenance and remaining available. The categories should be mutually understandable and consistently recorded.
Do not treat a higher utilization percentage as an automatic improvement. If vehicles are almost continuously busy but urgent tasks wait in queues, the system may lack spare capacity for demand peaks. If utilization is low, the cause may be insufficient task demand rather than excess fleet size.
Interpret utilization alongside completed moves, task waiting time, demand patterns and the amount of work that remained unfinished at the end of each period.
A transport task may fail even when the vehicle itself is functioning correctly. A load may be missing, a destination may be occupied or an external interface may not confirm that the next operation is ready.
Classify incidents according to the evidence available. At minimum, distinguish vehicle-related issues, warehouse process issues, site or traffic constraints and software or interface issues.
Track repeat incidents and their operational impact. A single incident category that accounts for a large share of lost time may be a better improvement target than the most frequently reported minor alarm.
Define how incidents are closed and who verifies the corrective action. Otherwise, the same problem may be recorded repeatedly without establishing whether the underlying cause has been resolved.
Vehicle metrics should be reviewed alongside the warehouse outcomes the automation is intended to support. Depending on the operation, these may include putaway completion, retrieval readiness, outbound staging performance or the time required to make received inventory available.
Compare similar periods and account for changes in demand, shift length, pallet mix and operating conditions. A simple before-and-after comparison can be misleading if the warehouse workload changed significantly between the two periods.
Where practical, retain a baseline from the pre-automation process and document how the baseline was measured. If the old process did not collect equivalent timestamps, state that limitation rather than presenting an unsupported direct comparison.
Use a daily review to identify immediate disruptions and a longer-period review to detect recurring patterns. Each indicator should have an owner, a data source and a defined response when results move outside the expected range.
| KPI | Operational Question |
|---|---|
| Successful task count | How much valid transport work was completed? |
| Task cycle time | Where is time being consumed? |
| Queue waiting time | Are tasks waiting for vehicles, loads or destinations? |
| Manual intervention | Which conditions prevent normal task completion? |
| Vehicle availability | How much fleet capacity is available for work? |
| Warehouse process completion | Is automation supporting the intended operation? |
Task, attempt, cancellation and completion definitions are documented.
Start and end timestamps are consistent.
Waiting time can be separated by cause where possible.
Vehicle utilization categories are clearly defined.
Incidents have a classification and closure process.
Warehouse outcomes are reviewed alongside vehicle metrics.
Each KPI has an owner and an agreed review frequency.
Key checkpoint: A useful KPI must support a decision. If the metric cannot help your team distinguish vehicle constraints from warehouse process delays, refine the definition before using it to judge system performance.
When planning an AGV forklift project, identify the operational questions that the reporting system must answer. Ask which timestamps, task states, vehicle states and incident details will be available, and how the data can be exported for analysis.
Confirm which KPIs can be calculated directly and which require additional warehouse-system records. Agree on the definitions before commissioning so that supplier reports and internal warehouse reports can be compared consistently.





 Chinese
 English