


When buying autonomous forklifts or AGVs from China, most buyers initially focus on payload capacity, lifting height, navigation technology, battery type, and safety systems. Once the project moves into the implementation stage, however, another question becomes equally important: what operational data will the fleet management software actually provide?
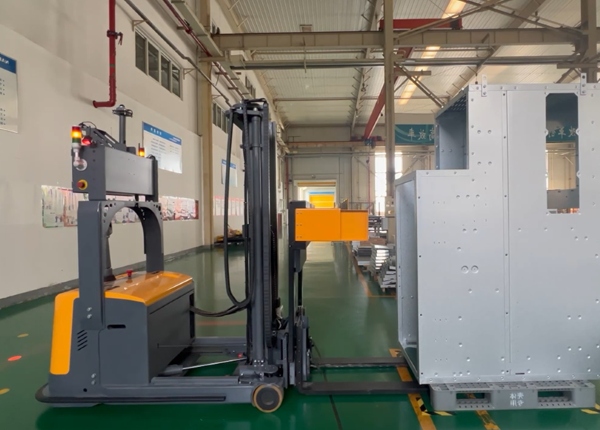
A fleet performance dashboard should do more than show the current location of each AGV. For a warehouse manager, the real value is knowing how efficiently the fleet is operating, why vehicles are waiting, which AGVs are generating repeated faults, how batteries are performing, and whether operational problems are becoming more frequent over time.
For companies importing AGVs from China, the exact dashboard functions depend on the supplier and software architecture. Therefore, buyers should evaluate the actual data available rather than assuming that every Chinese AGV platform provides the same analytics.
A useful fleet dashboard should provide both real-time status information and historical performance data. The exact list varies by system, but buyers should consider requesting at least the following metrics:
Total AGVs in the fleet.
Online and offline vehicles.
Active, idle, charging, and fault states.
Completed and pending missions.
Failed or interrupted missions.
Vehicle utilization.
Travel time and travel distance.
Idle and waiting time.
Average mission or cycle time.
Charging duration.
Battery State of Charge (SOC).
Battery State of Health (SOH), where supported.
Fault and alarm history.
Communication status.
Safety-related events.
The most valuable dashboards go beyond displaying individual vehicle information. They allow managers to compare vehicles, identify trends, and determine whether a performance problem is isolated to one AGV or affects the entire fleet.
Some AGV fleet management platforms may provide an OEE-style KPI, but buyers should be careful when comparing AGV OEE with the traditional Overall Equipment Effectiveness metric used in manufacturing.
Traditional OEE is generally associated with availability, performance, and quality in a production process. An autonomous forklift has a different purpose: it transports pallets and materials through a warehouse.
For an AGV fleet, metrics such as availability, utilization, mission completion rate, average cycle time, idle time, charging time, fault duration, and pallet throughput may provide more useful operational information than one combined OEE percentage.
If a Chinese AGV supplier claims that its software provides “real-time OEE,” the buyer should ask one simple follow-up question:
How exactly is your AGV OEE calculated?
The calculation should be clearly defined in the software specification. Otherwise, two suppliers may both advertise “OEE” while using completely different formulas.
This is one of the most useful metrics for warehouse managers because an AGV being online does not necessarily mean that it is productive.
Consider an AGV that is available for 20 hours. It may spend eight hours traveling, three hours handling pallets, four hours waiting for tasks, three hours charging, and two hours in fault or recovery states.
Without this breakdown, the manager may simply see that the AGV was online for most of the day. With the breakdown, the manager can investigate why a significant portion of the available operating time was not converted into productive work.
| Metric | What It Can Reveal |
|---|---|
| Travel Time | Actual vehicle movement during missions. |
| Handling Time | Time spent performing pallet pickup and placement operations. |
| Idle Time | Potential task shortages, traffic congestion, or process bottlenecks. |
| Charging Time | Battery utilization and charging strategy. |
| Fault Time | Lost operating capacity caused by equipment problems. |
This distinction can significantly change the way a warehouse evaluates automation performance. If an AGV fleet has excessive idle time, purchasing more AGVs may not solve the problem. The actual bottleneck could be traffic congestion, insufficient task volume, inefficient staging areas, WMS task release logic, or waiting for other warehouse processes.
Battery data becomes increasingly important as the fleet grows. A warehouse operating dozens of autonomous forklifts can accumulate a substantial amount of battery information over several years.
Depending on the battery management system and fleet software, useful information may include:
State of Charge (SOC).
State of Health (SOH).
Charging cycles.
Charging duration.
Battery voltage.
Battery temperature.
Charging warnings.
Battery fault records.
Historical battery performance.
There is an important difference between displaying battery information and allowing the customer to export historical battery records.
Before purchasing the system, ask whether weekly or monthly battery reports can be exported in formats such as CSV or Excel. If the warehouse has its own business intelligence platform, also ask whether battery information can be accessed through an API.
Historical battery data can help identify abnormal degradation. For example, if one vehicle repeatedly shows lower battery health or unusually long charging periods compared with the rest of the fleet, the maintenance team can investigate that vehicle before the issue creates an unexpected operational interruption.
For a multi-shift warehouse, automatic alerts can be more useful than requiring a supervisor to continuously watch the fleet dashboard.
Depending on the software configuration, potential alert events may include:
Critical hardware faults.
Battery abnormalities.
Charging failures.
Navigation failures.
Communication loss.
Safety sensor faults.
Emergency-stop events.
Repeated mission failures.
AGV offline conditions.
Other predefined equipment alarms.
However, “email notification supported” is not enough information for a procurement decision.
The buyer should ask what conditions trigger the notification, whether different alarm levels can be configured, and whether alerts can be assigned to different recipients.
For example, a critical hardware fault may need to notify a maintenance manager immediately, while a low-battery notification may only need to appear on the fleet dashboard.
Fleet-level averages can hide problems. A fleet may appear to have acceptable overall utilization while one vehicle is generating a disproportionate number of faults.
A useful dashboard should therefore allow managers to drill down from fleet-level statistics to individual vehicles.
For example, managers may want to compare:
Vehicle utilization.
Mission completion rate.
Average cycle time.
Idle time.
Charging frequency.
Battery health.
Fault frequency.
Distance traveled.
Operating hours.
This type of comparison is particularly useful for preventive maintenance. A vehicle that consistently performs worse than the rest of the fleet may deserve investigation even if it has not yet generated a critical alarm.
Historical data retention is easy to overlook during the purchasing process.
A dashboard may show today's information perfectly but provide limited access to records from six or twelve months ago. That can make it difficult to analyze long-term trends such as battery degradation, utilization changes, recurring faults, and seasonal warehouse demand.
Ask the Chinese supplier:
How long is historical fleet data stored?
Can the customer export historical records?
Is there a limit on the number of reports?
Can data be exported automatically?
Is API access available?
What happens to historical data if software support ends?
These questions become increasingly important when an AGV fleet is expected to operate for many years.
The best way to evaluate a fleet dashboard is to request a live demonstration rather than relying on screenshots in a product brochure.
Ask the supplier to demonstrate the following:
Show the real-time status of every AGV.
Show completed, pending, and failed missions.
Show travel time versus idle time.
Show individual vehicle utilization.
Show battery SOC and available SOH information.
Generate a weekly battery report.
Generate a weekly fleet performance report.
Display historical fault records.
Create a critical hardware alarm.
Demonstrate the resulting email notification.
Show the historical data retention period.
Demonstrate available export formats.
Explain whether fleet data can be accessed through an API.
This test should ideally be included in the software specification and FAT/SAT process. A screenshot proving that a feature exists is much less valuable than demonstrating that your own team can actually use it.
In practical warehouse automation, the number of charts on a dashboard is not a measure of software quality.
The more important question is whether the data helps the operations team make better decisions.
If idle time suddenly increases, the dashboard should help the team investigate traffic congestion, task allocation, staging constraints, or upstream process delays. If charging time increases, battery condition and charging behavior should be reviewed. If one AGV repeatedly generates navigation faults, the team should be able to identify that pattern from historical data rather than waiting for a complete equipment failure.
For buyers importing AGVs from China, this is why fleet software should be evaluated as carefully as the mechanical hardware.
Do not ask only, “Does your AGV system have a fleet dashboard?” Ask the supplier to show you exactly what your warehouse manager will see on Monday morning after a busy weekend shift.
If the system can clearly connect vehicle utilization, idle time, mission performance, battery condition, and equipment alarms with historical data, the dashboard becomes a genuine warehouse management tool rather than simply a screen showing where the robots are.
FREE ENGINEERING SUPPORT Stop Gambling on Generic Platforms. Get an AGV/AMR Tailored to Your Warehouse.Buying automated guided vehicles involves complex safety standards (CE/ANSI), navigation setups (Laser SLAM), and ERP system integration. Don't risk your factory safety with middle-men. ✓ 100% Direct Factory: Customized payload up to 5 Tons. ✓ Free CAD Simulation: Send us your layout, and our engineers will simulate the optimal AGV routes. ✓ Global Support: Overseas installation guidance & local maintenance partners. |





 Chinese
 English