


A fleet dashboard is more than a screen showing where automated forklifts are located.
For a warehouse operating multiple AGVs, the fleet management platform can become an important maintenance and operational management tool.
It can provide information about vehicle faults, battery status, utilization, operating history, traffic conditions, and maintenance requirements.
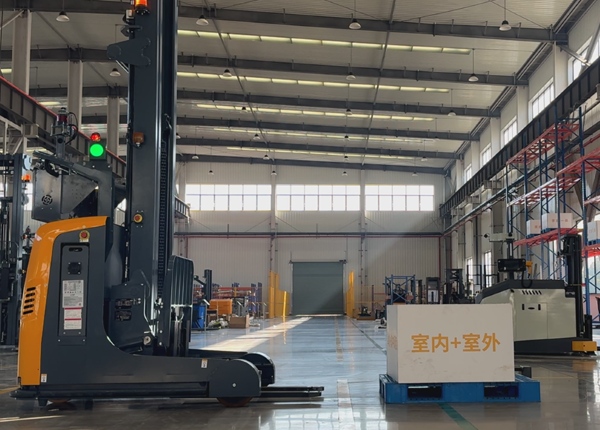
For companies importing Chinese AGVs, however, dashboard capabilities should be verified before the purchase. Different fleet management systems provide different levels of fault monitoring, alert configuration, historical data, visualization, and reporting. A supplier's statement that the system provides "real-time monitoring" does not necessarily mean that every maintenance alert or management report is included.
The exact alert list depends on the AGV model and fleet management software, but a properly configured system may monitor several categories of operating conditions.
Vehicle communication failures
Navigation faults
Safety scanner warnings
Emergency-stop events
Battery alarms
Low battery conditions
Charging failures
Drive motor faults
Steering system faults
Hydraulic system warnings
Lift system faults
Sensor failures
Localization errors
Abnormal vehicle temperatures
Communication network interruptions
Blocked-route events
Vehicle immobilization events
The dashboard should ideally distinguish between informational messages, warnings, and critical faults. This prevents maintenance teams from treating every message as an emergency.
Some fleet management platforms can generate automated notifications, but SMS availability should be confirmed with the supplier rather than assumed. The notification method may depend on the software architecture and local communication services.
Possible notification channels include:
Dashboard notifications
SMS
Mobile applications
Enterprise messaging systems
Webhook notifications
API-based alerts
For an overseas warehouse, local notification capability can be particularly important. If a critical AGV fault occurs during a night shift, the maintenance team should not have to continuously watch the fleet dashboard to discover the problem.
During the RFQ process, ask the Chinese supplier whether the system can send an alert automatically when a vehicle becomes unavailable, experiences a critical fault, reaches a battery threshold, or remains blocked for longer than a defined period.
Also confirm whether the notification service works entirely inside the customer's local network or requires an external cloud connection. This distinction can be important for facilities with strict IT security requirements.
Historical fault records are much more useful than a simple real-time alarm. A maintenance team can use historical data to identify recurring problems, determine which vehicles experience the most faults, and investigate whether particular components are approaching the end of their service life.
Useful historical information may include:
Fault code
Vehicle identification number
Timestamp
Operating condition
Battery state
Vehicle location
Fault duration
Recovery time
Operator intervention
Maintenance action
For example, if one AGV repeatedly reports a drive-wheel abnormality, the maintenance team can investigate the pattern before the vehicle experiences a complete failure. Similarly, repeated localization errors in the same warehouse area may indicate a mapping, environmental, or infrastructure issue rather than a vehicle hardware problem.
Historical fault data can support predictive maintenance, but buyers should distinguish between basic fault history and a true predictive-maintenance system.
A basic fleet platform may simply record that a fault occurred. A more advanced system may analyze trends such as:
Fault frequency
Operating hours
Battery degradation
Charging cycles
Motor operating hours
Travel distance
Repeated sensor faults
Maintenance intervals
Vehicle downtime
This information can help maintenance managers identify vehicles or components that deserve inspection before an unexpected breakdown. However, the presence of historical data alone does not prove that the software can accurately predict component failure.
When evaluating a supplier, ask the engineering team to demonstrate how the system moves from a historical fault record to a maintenance recommendation.
Many fleet management systems provide a visual warehouse map showing the location and operating status of connected vehicles. The exact visualization can range from a simple two-dimensional map to a more detailed graphical or 3D representation.
A useful local dashboard may display:
Current AGV position
Vehicle direction
Current task
Vehicle status
Battery level
Current speed
Fault condition
Destination
Reserved route segments
Charging status
For a large warehouse, real-time visualization can help supervisors quickly identify congestion, inactive vehicles, unexpected stops, and abnormal traffic patterns.
However, the buyer should specifically ask whether the dashboard can operate through the local corporate intranet. A system that requires every browser session to connect to an overseas cloud platform is different from a fleet server hosted entirely on the customer's local network.
The answer depends on the architecture selected for the project. Some AGV systems can operate with a locally installed fleet management server, while other systems may rely more heavily on cloud services.
For an industrial warehouse, the preferred architecture should be evaluated together with the company's IT and cybersecurity teams. Important questions include:
Can the fleet server operate entirely on the local network?
Does vehicle dispatch continue if the Internet connection is interrupted?
Can operators access the dashboard through the corporate intranet?
Is remote support optional or mandatory?
Can telemetry remain inside the customer's network?
Can historical data be exported?
Are API connections available for local systems?
These requirements should be documented before the project begins rather than discovered during commissioning.
Warehouse executives normally do not need the same level of technical information as a maintenance engineer. A useful fleet platform should therefore separate operational data from management-level KPIs.
Possible executive metrics include:
Fleet utilization rate
Completed pallet movements
Average mission cycle time
Vehicle availability
Vehicle downtime
Charging time
Idle time
Travel time
Fault frequency
Maintenance events
Battery utilization
Daily and weekly throughput
These metrics allow management to compare actual fleet performance against the original project assumptions. For example, a fleet may have 95% vehicle availability but still fail to achieve the expected throughput because vehicles spend too much time waiting at intersections or staging locations.
Utilization should not be treated as a single universal number. A warehouse should define what it means by "utilized" before using the metric in an executive report.
A dashboard might separate:
Productive travel time
Non-productive travel time
Loading time
Unloading time
Waiting time
Charging time
Fault downtime
Manual intervention time
This breakdown is more useful than simply reporting that an AGV was powered on for eight hours. An AGV that is powered on for an entire shift but spends three hours waiting for tasks is not delivering the same productivity as an AGV completing continuous pallet movements.
Data export is an important requirement for companies that want to perform their own analysis. The fleet platform should ideally provide structured data rather than locking all historical information inside the dashboard.
Potential export formats and interfaces include:
CSV
Excel-compatible reports
Database access
REST APIs
Webhooks
Scheduled reports
Business intelligence integrations
Before purchasing, ask whether exported data includes timestamps, vehicle identifiers, task identifiers, fault codes, battery information, and operational status. Also clarify whether historical data remains accessible after a software license expires or a maintenance contract ends.
Dashboard functionality should be included in the Factory Acceptance Test instead of being treated as a demonstration-only feature.
A practical test sequence can include:
Trigger a simulated vehicle fault.
Verify that the fault appears on the fleet dashboard.
Verify the timestamp and vehicle identification.
Confirm that the configured maintenance notification is generated.
Clear the fault and verify that the recovery is recorded.
Stop a vehicle and verify the status change on the map.
Check the live vehicle position against the actual warehouse position.
Export the corresponding operating record.
Generate a utilization report for the test period.
Verify that authorized users can access the dashboard through the agreed network architecture.
The test should also verify what happens if the local fleet server loses communication with one or more AGVs. The dashboard should clearly distinguish between a vehicle fault and a communication fault.
| Dashboard Requirement | Question for the Supplier |
|---|---|
| Maintenance Alerts | Which vehicle and maintenance faults can generate automatic alerts? |
| SMS Notifications | Can alerts be sent to local maintenance personnel by SMS or another local notification service? |
| Fault History | How long are historical fault records retained? |
| Predictive Maintenance | Does the system provide predictive maintenance functions or only historical fault records? |
| Live Map | Can supervisors view all AGVs on a local intranet map in real time? |
| Executive Reports | Can the system automatically generate weekly and monthly fleet KPI reports? |
| Data Export | Can fleet, fault, battery, and utilization data be exported through standard formats or APIs? |
| Local Hosting | Can the complete fleet dashboard operate on the customer's local server without a permanent Internet connection? |
The most useful fleet dashboard is not necessarily the one with the most visual features. Its value comes from turning vehicle data into actionable information.
A maintenance engineer needs to know which AGV has a fault and what happened before the fault. A warehouse supervisor needs to know why vehicles are waiting and where congestion is developing. An operations manager needs to know whether the fleet is achieving its planned throughput. An executive needs to know whether the automation project is delivering the expected productivity and cost improvements.
For this reason, buyers should evaluate the dashboard at three levels:
Maintenance: faults, alerts, component status, service history and downtime.
Operations: vehicle location, tasks, traffic, utilization and throughput.
Management: KPIs, trends, productivity and long-term fleet performance.
When purchasing automated forklifts from China, these dashboard requirements should be written into the technical specification and verified during FAT and SAT. This creates a clear performance baseline and prevents a sophisticated-looking dashboard from becoming a system that provides data but does not support actual warehouse decision-making.
FREE ENGINEERING SUPPORT Stop Gambling on Generic Platforms. Get an AGV/AMR Tailored to Your Warehouse.Buying automated guided vehicles involves complex safety standards (CE/ANSI), navigation setups (Laser SLAM), and ERP system integration. Don't risk your factory safety with middle-men. ✓ 100% Direct Factory: Customized payload up to 5 Tons. ✓ Free CAD Simulation: Send us your layout, and our engineers will simulate the optimal AGV routes. ✓ Global Support: Overseas installation guidance & local maintenance partners. |





 Chinese
 English