


Installing an autonomous forklift fleet is not the end of an automation project.
After several months of operation, warehouse conditions can change.
Storage locations may move. SKU profiles can change. Pallet volumes can increase. New pedestrian areas may appear. Charging patterns can change as the fleet grows.
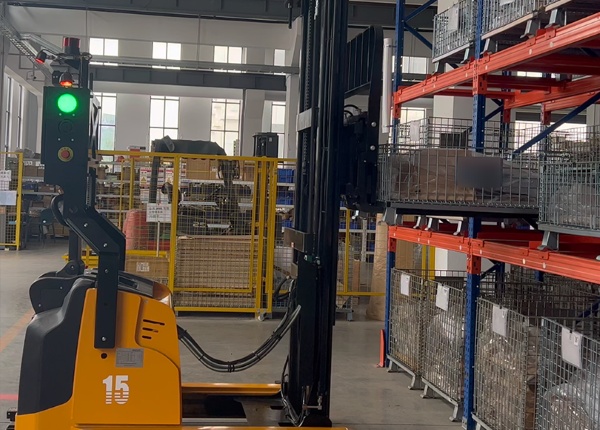
As a result, an AGV system that originally delivered the expected throughput may gradually develop:
Longer travel distances
Increased waiting time
More traffic conflicts
Lower vehicle utilization
Longer charging queues
Reduced pallet cycles per hour
A long-term AGV audit provides a structured way to identify these changes and determine whether the problem comes from vehicle performance, warehouse layout, traffic rules, charging strategy or software configuration.
There is no single schedule suitable for every warehouse.
A practical approach is to combine several levels of review.
Track basic operating conditions:
Vehicle faults
Battery status
Completed tasks
Emergency stops
Charging interruptions
Communication failures
Analyze:
Pallets moved
Average task duration
Vehicle utilization
Idle time
Charging time
Traffic congestion
Failed tasks
Review whether:
Warehouse routes have changed
Storage locations have changed
Traffic volumes have changed
New equipment has been added
Pedestrian traffic has increased
Fleet capacity remains appropriate
Compare the current system against the original project targets.
This is where the warehouse can evaluate:
Actual throughput vs. designed throughput
Actual operating cost vs. projected operating cost
Actual fleet utilization vs. planned utilization
Actual maintenance cost vs. expected maintenance cost
Some Chinese AGV manufacturers offer ongoing technical support or optimization services, but this should not be assumed to be included automatically.
The commercial agreement should clearly define:
Remote support period
Response time
Software maintenance
Fleet optimization
Map optimization
Traffic optimization
Remote diagnostics
Software upgrades
On-site engineering support
For a large warehouse, it can be useful to negotiate an annual optimization review into the service agreement.
The manufacturer can analyze operational data and identify areas where the original deployment configuration no longer matches actual warehouse activity.
The exact data available depends on the fleet-management platform.
For a long-term audit, useful data may include:
AGV operating hours
Vehicle utilization
Number of completed tasks
Failed tasks
Fault frequency
Emergency stops
Average task duration
Congestion locations
Waiting time
Intersection utilization
Route occupancy
Average travel speed
Traffic conflicts
Charging frequency
Charging duration
Battery state of charge
Battery state of health
Charging interruptions
Battery-related alarms
Pallets transported
Pickup locations
Delivery locations
Travel distance
Peak-hour demand
Task distribution
The objective is to connect vehicle activity with warehouse output.
A common mistake is comparing the AGV purchase price with the previous forklift purchase price.
A better analysis compares the total cost of performing the same logistics work.
Start with the original baseline.
Record:
Number of operators
Labor cost
Operating hours
Fuel or electricity
Maintenance
Tire replacement
Accident costs
Productivity
Pallets moved
Then measure the equivalent AGV operation.
Track:
Electricity
Maintenance
Spare parts
Software fees
Technical support
Battery replacement
Insurance
Labor required for supervision
The comparison can then be expressed as:
Cost per pallet moved
This is often more useful than simply comparing annual equipment costs.
This depends on the software architecture and the supplier's data-access policy.
Before purchasing, ask whether the system supports:
CSV export
Excel export
API access
Database access
SQL reporting
REST API
Historical task records
Vehicle telemetry export
For enterprise customers, API access is particularly useful because the warehouse can integrate AGV data with its own:
WMS
ERP
BI platform
Data warehouse
ESG reporting system
The contract should define what operational data belongs to the customer and how that data can be accessed.
Not every data point has equal value.
For throughput analysis, prioritize:
Timestamp → AGV ID → Pickup location → Delivery location → Task start → Task completion → Travel distance → Waiting time → Fault status
This allows the warehouse to reconstruct the actual material-flow process.
For example, if the average pallet task takes 180 seconds but 45 seconds is spent waiting at an intersection, the problem may not be the AGV's driving speed.
The bottleneck may be traffic management.
When throughput drops, don't immediately assume the AGVs have become slower.
Check the entire operating environment.
Have pickup and delivery locations changed?
A longer route can reduce the number of completed tasks per hour.
Are more AGVs competing for the same intersections?
Check:
Waiting time
Congestion
One-way lanes
Intersection priorities
Are vehicles spending more time waiting for charging?
Check whether fleet growth has created charging congestion.
Has pallet demand changed?
A different mix of short-distance and long-distance tasks can significantly affect fleet utilization.
Check whether manual forklifts, pallet jacks or pedestrians are frequently entering AGV routes.
Changes to rack locations can increase travel distances or create inefficient routes.
New safety restrictions may have introduced additional slow-speed areas.
Check whether the fleet has an increasing number of:
Faults
Maintenance events
Battery issues
Communication failures
This creates a much more complete diagnosis than simply checking vehicle speed.
Start by analyzing waiting time.
Suppose five AGVs repeatedly pass through the same intersection.
If the vehicles spend a large proportion of their operating time waiting there, the intersection may be limiting fleet throughput.
The warehouse can then investigate:
Lane priority
One-way routing
Intersection reservation
Waiting zones
Alternative routes
Traffic restrictions
A heat map from the fleet-management system can make these bottlenecks easier to identify if the platform supports this function.
Potentially, but the level of access depends on the manufacturer's software architecture.
Some systems allow authorized users to modify:
Route priorities
One-way lanes
Speed zones
Restricted areas
Traffic priorities
Charging priorities
Task priorities
More fundamental changes to the dispatch algorithm may require support from the manufacturer.
Examples include changing:
Task-allocation logic
Optimization algorithms
Fleet scheduling algorithms
Core navigation behavior
Safety logic
These changes should generally be controlled through the supplier's software-change process.
Not necessarily.
A better approach is to define different levels of access.
Can typically:
View vehicle status
Monitor tasks
Handle basic exceptions
May additionally:
Adjust task priorities
Manage zones
Change operating schedules
Review performance reports
May need:
Fault diagnostics
Maintenance records
Device status
Sensor information
May require:
Server administration
Network configuration
API management
Database backup
System integration
May have:
Advanced diagnostics
Software configuration
Algorithm parameters
Remote troubleshooting
This reduces the risk of unauthorized changes to critical fleet functions.
Treat it as an engineering change.
Before modifying the production system:
Current configuration → Proposed change → Simulation/test → Approval → Deployment → Monitoring
The change should have:
Version number
Change description
Reason
Expected benefit
Test result
Rollback procedure
This becomes particularly important when the warehouse operates a large fleet continuously.
For major changes, simulation can be valuable.
A simulation can help compare:
Current layout
Proposed layout
Current fleet size
Increased fleet size
Different traffic priorities
Alternative charging strategies
For example, before adding five AGVs, the warehouse could evaluate whether the additional vehicles actually increase throughput.
More vehicles do not always mean proportionally more pallets per hour.
At some point, traffic congestion can become the limiting factor.
A useful annual report can be divided into six sections.
Vehicle utilization
Availability
Fault rate
Completed tasks
Average task duration
Pallets per hour
Pallets per shift
Peak throughput
Average throughput
Congestion locations
Average waiting time
Intersection utilization
Route efficiency
Charging cycles
Charging time
Battery health
Energy consumption
Operating cost
Maintenance cost
Labor cost
Cost per pallet
Estimated annual savings
Layout changes
Routing changes
Fleet expansion
Charging optimization
Software upgrades
This gives management a clear picture of whether the automation system is still delivering the expected business value.
Do not base fleet expansion only on the number of vehicles currently operating.
Look at:
Peak pallet demand + average task time + available operating time + vehicle utilization + traffic constraints
If the current fleet is already heavily utilized but traffic remains low, additional vehicles may improve throughput.
If the current fleet is frequently waiting because of congestion, adding vehicles may make the problem worse.
In that situation, the better investment may be:
Route optimization
Intersection redesign
Additional staging areas
Charging optimization
Warehouse layout changes
Keep the original project assumptions.
After six or twelve months, compare actual performance against the original design:
| KPI | Original Target | Actual Result |
|---|---|---|
| Pallets/hour | Project target | Measured |
| AGV utilization | Project target | Measured |
| Task completion time | Project target | Measured |
| Battery charging time | Project target | Measured |
| Fleet availability | Project target | Measured |
| Cost/pallet | Project estimate | Measured |
| Annual operating cost | Project estimate | Measured |
This makes it possible to determine whether the system is delivering the business case originally used to justify the investment.
A Chinese AGV fleet should not be treated as a system that is installed once and then left unchanged for five years.
A better lifecycle is:
Baseline → Deployment → Measurement → Audit → Optimization → Validation → Continuous Monitoring
The first audit establishes whether the fleet is performing according to the original project design.
Later audits determine whether changes in warehouse volume, layout, traffic, battery condition or software configuration are affecting performance.
For a large B2B warehouse, the most valuable long-term question is therefore not simply:
“Are my AGVs still working?”
It is:
“Are my AGVs still moving pallets at the lowest practical cost and with the throughput my warehouse requires?”
That question turns fleet management from equipment maintenance into continuous logistics optimization.
FREE ENGINEERING SUPPORT Stop Gambling on Generic Platforms. Get an AGV/AMR Tailored to Your Warehouse.Buying automated guided vehicles involves complex safety standards (CE/ANSI), navigation setups (Laser SLAM), and ERP system integration. Don't risk your factory safety with middle-men. ✓ 100% Direct Factory: Customized payload up to 5 Tons. ✓ Free CAD Simulation: Send us your layout, and our engineers will simulate the optimal AGV routes. ✓ Global Support: Overseas installation guidance & local maintenance partners. |
📖 AGV Forklift Guide — Essential manual for selection and safety.
⚙️ How AGV Systems Work — A deep dive into navigation and logic.
⚖️ AGV vs. AMR Comparison — Choosing the right technology for your facility.
💰 AGV Cost and ROI — Evaluating investment and payback periods.





 Chinese
 English