How to Calculate AGV Forklift Fleet Size for Warehouse Operations


WAREHOUSE AUTOMATION GUIDE

How to Calculate AGV Forklift Fleet Size for Warehouse Operations

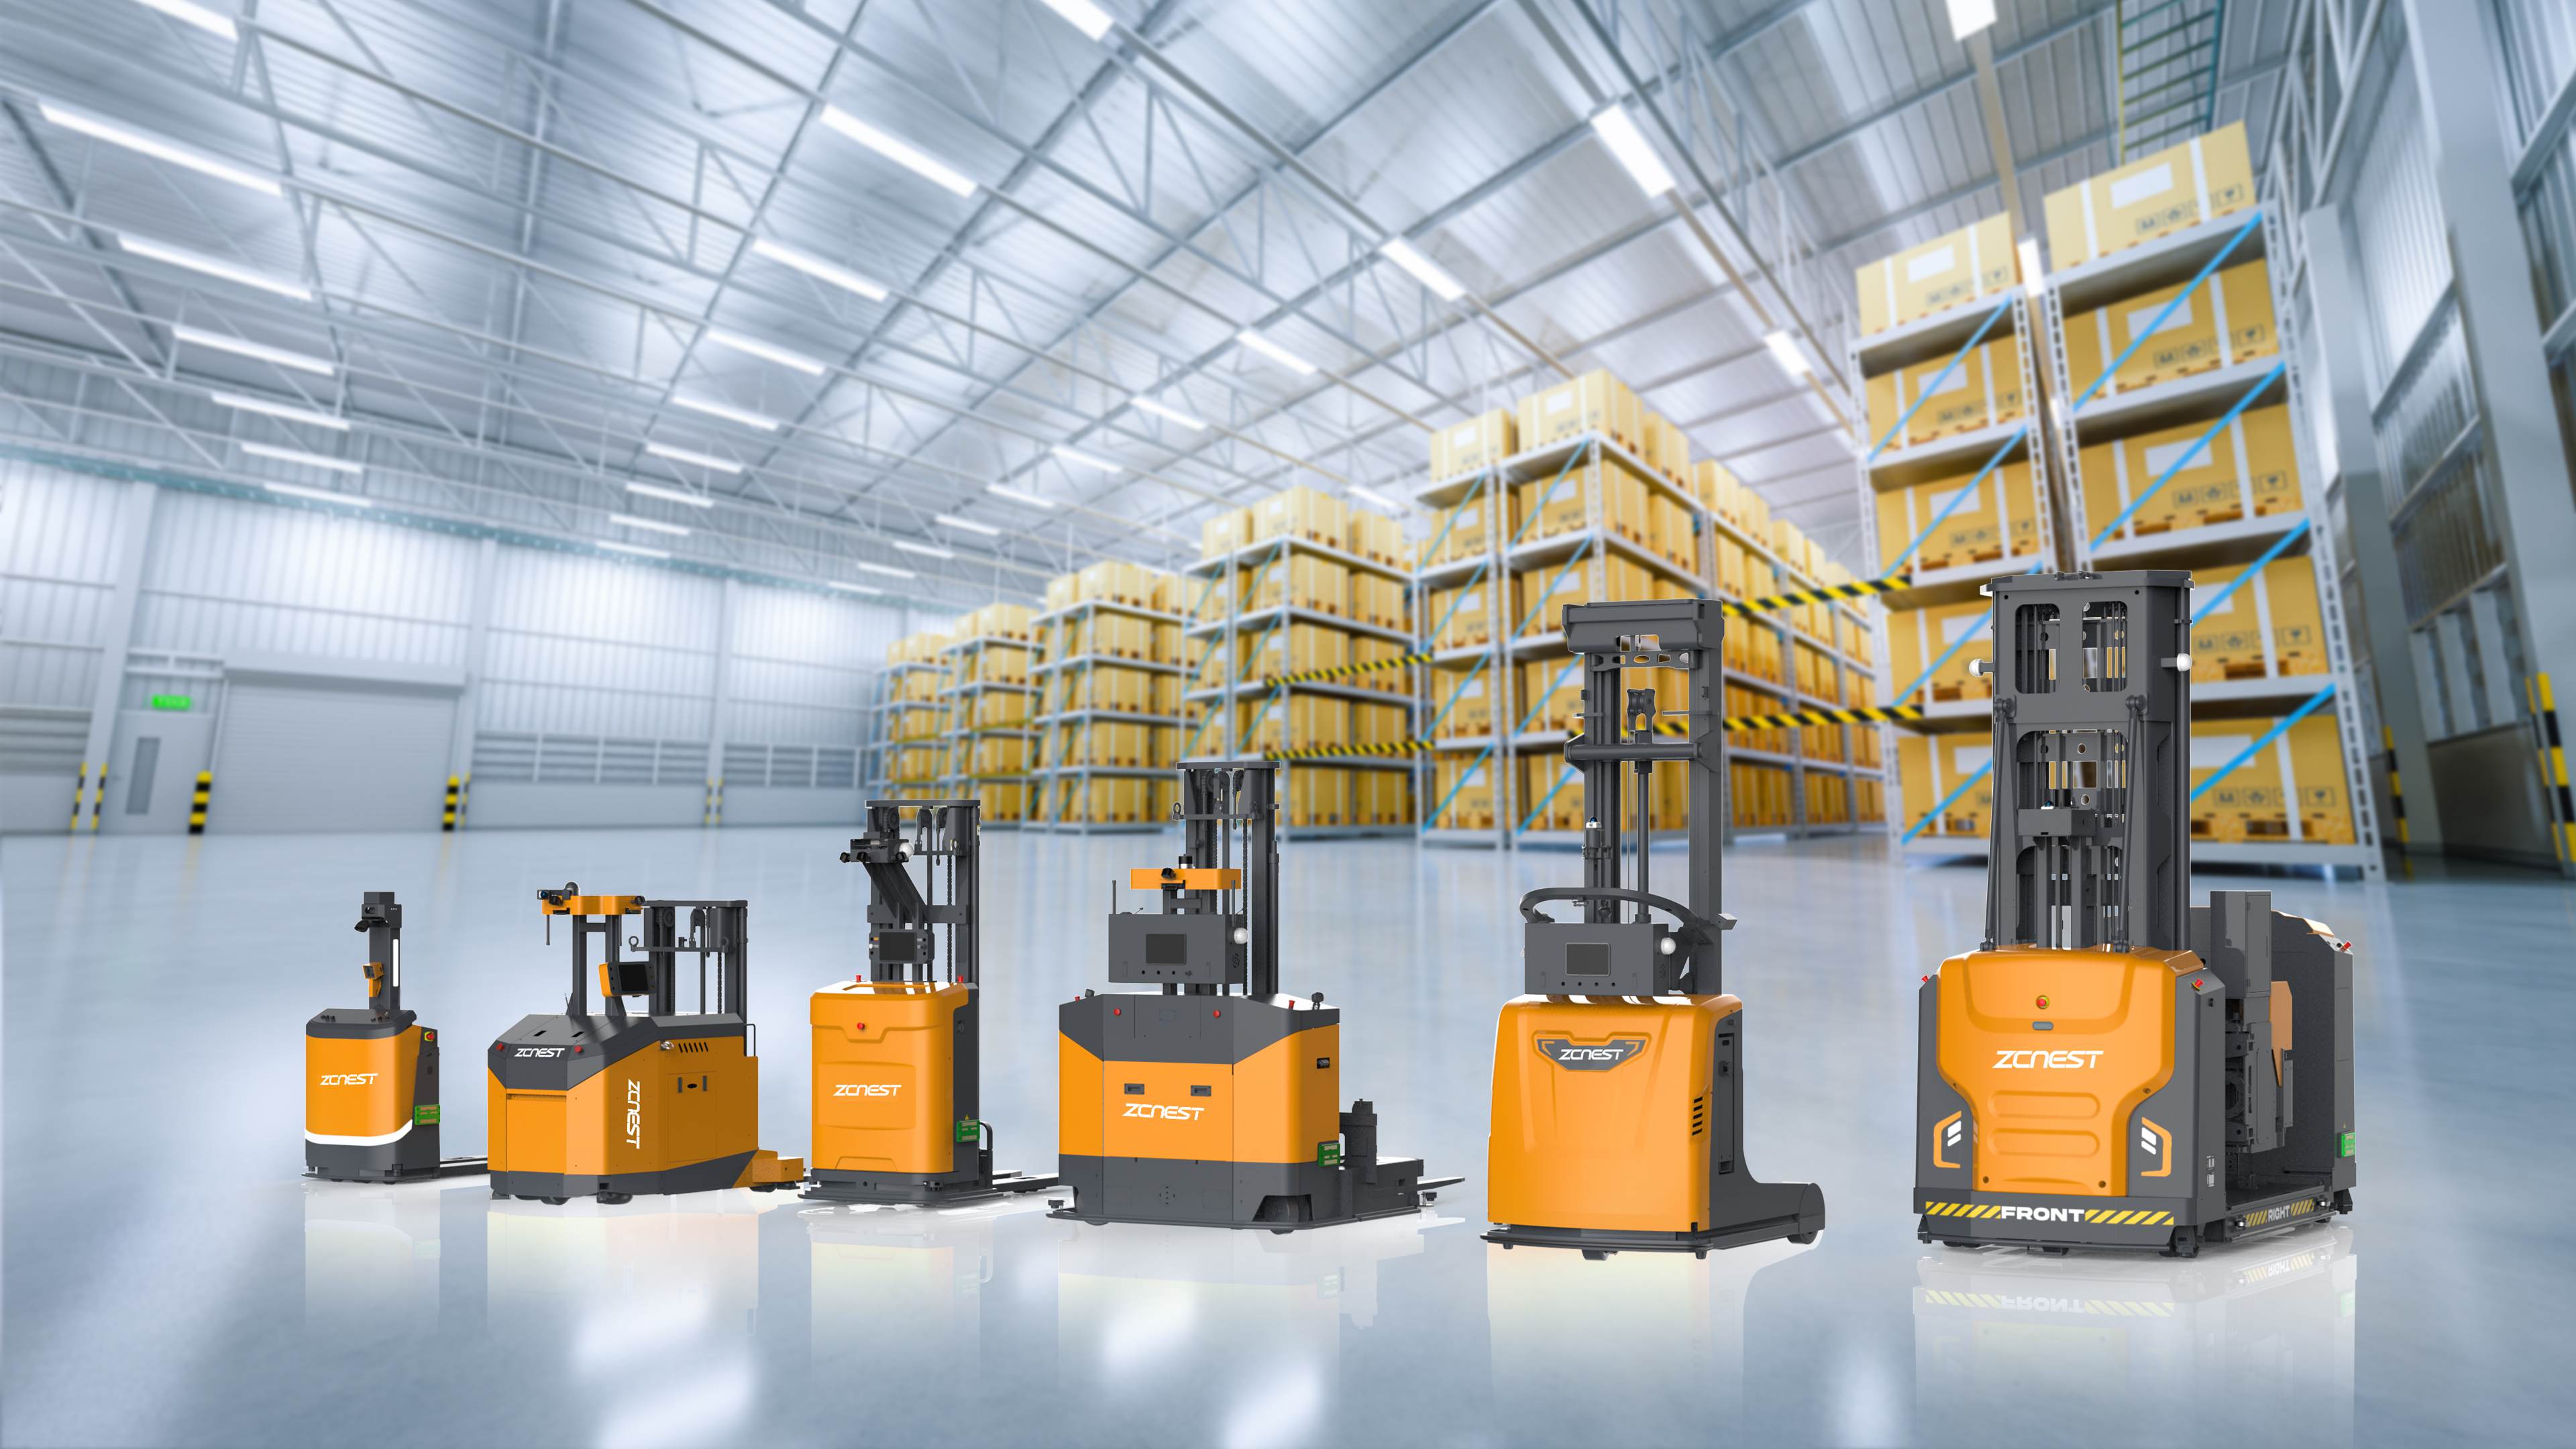
Determine how many autonomous forklifts your warehouse needs by evaluating material flow, travel distance, task cycles, peak demand, and fleet availability before finalizing an automation investment.
```html <p><br/></p> <section style="margin-bottom:60px;padding:60px 45px;background:#0f172a;color:#ffffff;border-radius:4px;text-align:center;border-top:10px solid #06b6d4;">     <p><span style="font-size:18px;color:#a5f3fc;">WAREHOUSE AUTOMATION GUIDE</span></p>     <h1 style="color:#ffffff;font-size:42px;margin-top:0;margin-bottom:30px;font-weight:800;line-height:1.2;">         <span style="color:#06b6d4;font-size:28px;">How to Calculate AGV Forklift Fleet Size for Warehouse Operations</span>     </h1>     <p style="font-size:20px;line-height:1.8;max-width:850px;margin:0 auto;color:#e2e8f0;">Determine how many autonomous forklifts your warehouse needs by evaluating material flow, travel distance, task cycles, peak demand, and fleet availability before finalizing an automation investment.</p> </section> <p style="text-align:center;">     <img src="/../../upload/image/REPLACE_WITH_REAL_IMAGE.jpg" alt="AGV forklift fleet planning for warehouse material handling" width="500" height="358" border="0" vspace="0" style="width:500px;height:358px;"/> </p>  <section style="margin-bottom:45px;">     <h2 style="font-size:30px;color:#0f172a;border-bottom:3px solid #06b6d4;padding-bottom:12px;">01. Start With Material Flow, Not Forklift Quantity</h2>     <p style="font-size:18px;line-height:1.9;color:#334155;">The correct AGV forklift fleet size depends on the workload the warehouse must handle, not simply the number of manual forklifts currently in operation. Manual fleets often include spare equipment, vehicles assigned to different shifts, and forklifts that operate intermittently. Replacing them one-for-one with autonomous equipment can result in unnecessary investment or insufficient capacity.</p>     <p style="font-size:18px;line-height:1.9;color:#334155;">Begin by documenting the movements the automated fleet will perform. Typical warehouse tasks include transporting pallets from receiving to storage, replenishing picking locations, moving goods between storage zones, and delivering outbound pallets to staging areas.</p>     <p style="font-size:18px;line-height:1.9;color:#334155;">For each movement, record the number of trips, pickup and drop-off locations, load characteristics, travel distance, and required completion time. These figures establish the workload that the AGV fleet must support.</p> </section>  <section style="margin-bottom:45px;">     <h2 style="font-size:30px;color:#0f172a;border-bottom:3px solid #06b6d4;padding-bottom:12px;">02. Calculate the Average Task Cycle Time</h2>     <p style="font-size:18px;line-height:1.9;color:#334155;">An AGV forklift cycle includes more than driving from one point to another. Depending on the application, the cycle may include approaching a pallet, aligning the forks, lifting the load, traveling, positioning the pallet, lowering the forks, and moving to the next task.</p>     <p style="font-size:18px;line-height:1.9;color:#334155;">For a preliminary estimate, use the following relationship:</p>     <div style="padding:28px;background:#f1f5f9;border-left:6px solid #06b6d4;margin:25px 0;">         <p style="font-size:22px;line-height:1.8;color:#0f172a;text-align:center;margin:0;"><strong>Average cycle time = Travel time + Pickup time + Drop-off time + Waiting time</strong></p>     </div>     <p style="font-size:18px;line-height:1.9;color:#334155;">Travel time should account for loaded and unloaded movements. Pickup and drop-off time depends on pallet quality, fork entry conditions, rack geometry, and positioning accuracy. Waiting time may arise from aisle congestion, shared intersections, blocked transfer points, or traffic-control rules.</p>     <p style="font-size:18px;line-height:1.9;color:#334155;">Use measured data from the actual warehouse wherever possible. Supplier cycle-time estimates are useful for comparison, but assumptions about route length, traffic, and handling conditions should be checked against the planned site layout.</p> </section>  <section style="margin-bottom:45px;">     <h2 style="font-size:30px;color:#0f172a;border-bottom:3px solid #06b6d4;padding-bottom:12px;">03. Estimate the Fleet's Effective Capacity</h2>     <p style="font-size:18px;line-height:1.9;color:#334155;">A simple capacity estimate divides the available operating time by the average cycle time. However, this theoretical figure is not the same as the number of tasks a fleet can reliably complete during a shift.</p>     <div style="padding:28px;background:#f1f5f9;border-left:6px solid #06b6d4;margin:25px 0;">         <p style="font-size:22px;line-height:1.8;color:#0f172a;text-align:center;margin:0;"><strong>Tasks per vehicle = Effective operating time ÷ Average task cycle time</strong></p>     </div>     <p style="font-size:18px;line-height:1.9;color:#334155;">Effective operating time should exclude planned charging, maintenance, shift handovers, and other periods when the vehicle cannot perform productive transport work. Additional allowance may be required for congestion, task variability, and temporary disruptions.</p>     <p style="font-size:18px;line-height:1.9;color:#334155;">For planning purposes, estimate capacity under normal operating conditions and then validate it during a site trial. Do not assume that every vehicle can continuously achieve its best-case cycle time throughout the shift.</p> </section>  <section style="margin-bottom:45px;">     <h2 style="font-size:30px;color:#0f172a;border-bottom:3px solid #06b6d4;padding-bottom:12px;">04. Account for Peak Demand and Traffic Constraints</h2>     <p style="font-size:18px;line-height:1.9;color:#334155;">Daily average throughput can conceal short periods of intense demand. Receiving schedules, production replenishment windows, shift changes, and outbound dispatch cutoffs can create peaks that require more capacity than the daily average suggests.</p>     <p style="font-size:18px;line-height:1.9;color:#334155;">Build a demand profile by hour or operating window. Identify when tasks must be completed, which routes are shared, and whether several vehicles need to use the same aisle or transfer point simultaneously.</p>     <ul style="font-size:18px;line-height:1.9;color:#334155;padding-left:25px;">         <li>Check whether narrow aisles restrict two-way traffic.</li>         <li>Identify intersections, doors, lifts, and staging areas that may become bottlenecks.</li>         <li>Separate urgent dispatch tasks from routine replenishment where operationally appropriate.</li>         <li>Test whether the fleet can recover after a temporary increase in demand.</li>         <li>Review how manual forklifts and pedestrians affect shared routes.</li>     </ul>     <p style="font-size:18px;line-height:1.9;color:#334155;">Adding vehicles does not always increase throughput. If the primary constraint is a congested aisle, blocked handover station, or slow pallet pickup process, the layout or task sequence may need to be improved first.</p> </section>  <section style="margin-bottom:45px;padding:35px;background:#0f172a;border-radius:4px;color:#ffffff;">     <h2 style="font-size:28px;color:#67e8f9;margin-top:0;">THE FLEET-SIZING MODEL</h2>     <p style="font-size:18px;line-height:1.9;color:#e2e8f0;">Use this framework to compare the required workload with the verified capacity of one vehicle.</p>     <div style="margin:20px 0;padding:20px;background:#1e293b;">         <p style="font-size:18px;color:#67e8f9;margin:0 0 8px;"><strong>INPUT 01 — REQUIRED WORKLOAD</strong></p>         <p style="font-size:18px;line-height:1.8;color:#ffffff;margin:0;">Required pallet movements per hour, shift, or day, including peak-period demand.</p>     </div>     <div style="margin:20px 0;padding:20px;background:#1e293b;">         <p style="font-size:18px;color:#67e8f9;margin:0 0 8px;"><strong>INPUT 02 — VERIFIED VEHICLE CAPACITY</strong></p>         <p style="font-size:18px;line-height:1.8;color:#ffffff;margin:0;">Productive movements per vehicle under the intended route, load, and operating conditions.</p>     </div>     <div style="margin:20px 0;padding:20px;background:#1e293b;">         <p style="font-size:18px;color:#67e8f9;margin:0 0 8px;"><strong>INPUT 03 — OPERATIONAL RESERVE</strong></p>         <p style="font-size:18px;line-height:1.8;color:#ffffff;margin:0;">Additional capacity justified by downtime risk, service requirements, and recovery needs.</p>     </div>     <p style="font-size:18px;line-height:1.9;color:#e2e8f0;">A preliminary calculation is the required task volume divided by the achievable task volume per vehicle, rounded up to a whole vehicle. The result must then be checked against peak demand, traffic flow, charging arrangements, and redundancy requirements.</p> </section>  <section style="margin-bottom:45px;">     <h2 style="font-size:30px;color:#0f172a;border-bottom:3px solid #06b6d4;padding-bottom:12px;">05. Validate Charging, Availability, and Recovery Capacity</h2>     <p style="font-size:18px;line-height:1.9;color:#334155;">Charging strategy affects the number of vehicles available for work at any given time. A fleet using opportunity charging may have a different availability profile from one using scheduled charging windows or battery replacement.</p>     <p style="font-size:18px;line-height:1.9;color:#334155;">Ask the supplier to model charging around the actual shift pattern, duty cycle, battery configuration, and charging infrastructure. Confirm whether charging locations can be accessed without blocking high-priority routes.</p>     <p style="font-size:18px;line-height:1.9;color:#334155;">Also define the recovery process for a vehicle that stops in an aisle, loses communication, or requires maintenance. A practical fleet plan should specify how blocked routes are handled, how tasks are reassigned, and whether the remaining vehicles can maintain essential warehouse operations.</p> </section>  <section style="margin-bottom:45px;">     <h2 style="font-size:30px;color:#0f172a;border-bottom:3px solid #06b6d4;padding-bottom:12px;">06. What to Request From an AGV Forklift Supplier</h2>     <p style="font-size:18px;line-height:1.9;color:#334155;">To compare proposals fairly, give each supplier the same operating assumptions and request a documented capacity estimate. The proposal should explain both the recommended fleet size and the constraints that influence it.</p>     <ul style="font-size:18px;line-height:1.9;color:#334155;padding-left:25px;">         <li>Expected task volume by hour and shift.</li>         <li>Route distances and pickup/drop-off locations.</li>         <li>Vehicle cycle-time assumptions for loaded and unloaded travel.</li>         <li>Charging, maintenance, and availability assumptions.</li>         <li>Traffic-management logic and aisle-capacity constraints.</li>         <li>Expected performance during peak demand.</li>         <li>Results and acceptance criteria for a site-based proof of concept.</li>     </ul>     <p style="font-size:18px;line-height:1.9;color:#334155;">A credible recommendation should connect vehicle quantity to measurable operating requirements. If the supplier cannot explain the assumptions behind the proposed fleet size, the estimate is not yet sufficient for an investment decision.</p> </section>  <section style="margin:50px 0;padding:35px;background:#ecfeff;border:1px solid #a5f3fc;border-radius:4px;">     <h2 style="font-size:28px;color:#0f172a;margin-top:0;">Planning an AGV Forklift Fleet for Your Warehouse?</h2>     <p style="font-size:18px;line-height:1.9;color:#334155;">Share your pallet movement volume, operating shifts, travel distances, load specifications, and warehouse layout. ZCNest can help evaluate suitable forklift configurations and discuss the information needed for a realistic fleet-capacity assessment.</p>     <p style="text-align:center;margin:28px 0 10px;">         <a href="mailto:market@zcnest.com?subject=AGV%20Forklift%20Fleet%20Sizing%20Inquiry" style="display:inline-block;background:#0891b2;color:#ffffff;text-decoration:none;padding:16px 32px;font-size:20px;font-weight:bold;border-radius:3px;">GET EXPERT CONSULTATION</a>     </p> </section>  <p style="font-size:18px;line-height:1.8;color:#334155;"><strong>SEO Title:</strong> How to Calculate AGV Forklift Fleet Size for Warehouses</p> <p style="font-size:18px;line-height:1.8;color:#334155;"><strong>Meta Description:</strong> Learn how to size an AGV forklift fleet using pallet movement demand, cycle time, peak throughput, charging availability, and warehouse traffic constraints.</p> ```.jpg

01. Start With Material Flow, Not Forklift Quantity

The correct AGV forklift fleet size depends on the workload the warehouse must handle, not simply the number of manual forklifts currently in operation. Manual fleets often include spare equipment, vehicles assigned to different shifts, and forklifts that operate intermittently. Replacing them one-for-one with autonomous equipment can result in unnecessary investment or insufficient capacity.

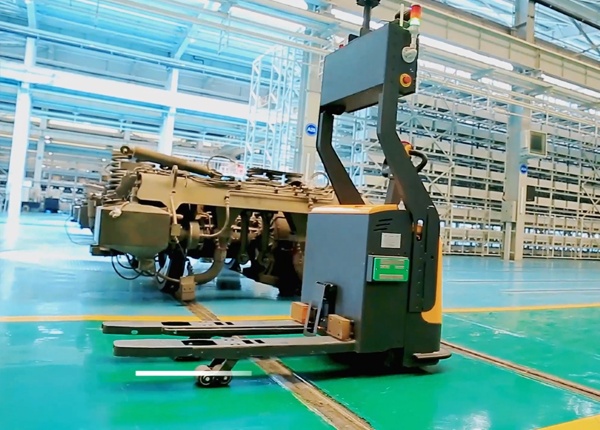
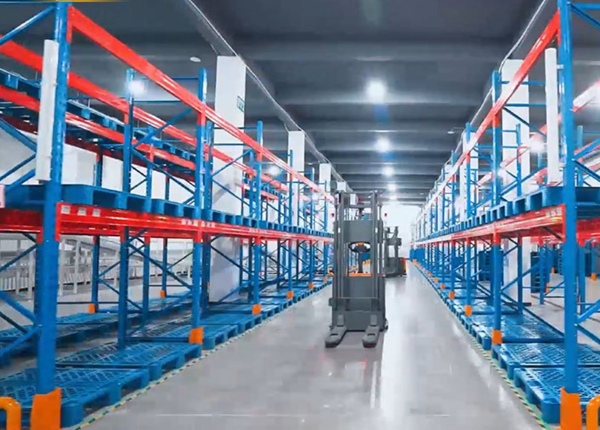
Begin by documenting the movements the automated fleet will perform. Typical warehouse tasks include transporting pallets from receiving to storage, replenishing picking locations, moving goods between storage zones, and delivering outbound pallets to staging areas.

For each movement, record the number of trips, pickup and drop-off locations, load characteristics, travel distance, and required completion time. These figures establish the workload that the AGV fleet must support.

02. Calculate the Average Task Cycle Time

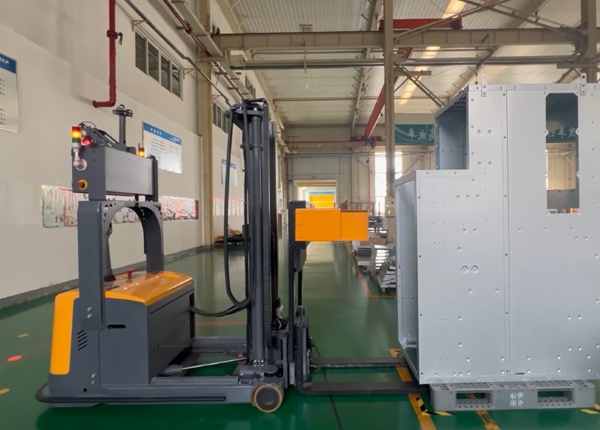
An AGV forklift cycle includes more than driving from one point to another. Depending on the application, the cycle may include approaching a pallet, aligning the forks, lifting the load, traveling, positioning the pallet, lowering the forks, and moving to the next task.

For a preliminary estimate, use the following relationship:

Average cycle time = Travel time + Pickup time + Drop-off time + Waiting time

Travel time should account for loaded and unloaded movements. Pickup and drop-off time depends on pallet quality, fork entry conditions, rack geometry, and positioning accuracy. Waiting time may arise from aisle congestion, shared intersections, blocked transfer points, or traffic-control rules.

Use measured data from the actual warehouse wherever possible. Supplier cycle-time estimates are useful for comparison, but assumptions about route length, traffic, and handling conditions should be checked against the planned site layout.

03. Estimate the Fleet's Effective Capacity

A simple capacity estimate divides the available operating time by the average cycle time. However, this theoretical figure is not the same as the number of tasks a fleet can reliably complete during a shift.

Tasks per vehicle = Effective operating time ÷ Average task cycle time

Effective operating time should exclude planned charging, maintenance, shift handovers, and other periods when the vehicle cannot perform productive transport work. Additional allowance may be required for congestion, task variability, and temporary disruptions.

For planning purposes, estimate capacity under normal operating conditions and then validate it during a site trial. Do not assume that every vehicle can continuously achieve its best-case cycle time throughout the shift.

04. Account for Peak Demand and Traffic Constraints

Daily average throughput can conceal short periods of intense demand. Receiving schedules, production replenishment windows, shift changes, and outbound dispatch cutoffs can create peaks that require more capacity than the daily average suggests.

Build a demand profile by hour or operating window. Identify when tasks must be completed, which routes are shared, and whether several vehicles need to use the same aisle or transfer point simultaneously.

  • Check whether narrow aisles restrict two-way traffic.

  • Identify intersections, doors, lifts, and staging areas that may become bottlenecks.

  • Separate urgent dispatch tasks from routine replenishment where operationally appropriate.

  • Test whether the fleet can recover after a temporary increase in demand.

  • Review how manual forklifts and pedestrians affect shared routes.

Adding vehicles does not always increase throughput. If the primary constraint is a congested aisle, blocked handover station, or slow pallet pickup process, the layout or task sequence may need to be improved first.

THE FLEET-SIZING MODEL

Use this framework to compare the required workload with the verified capacity of one vehicle.

INPUT 01 — REQUIRED WORKLOAD

Required pallet movements per hour, shift, or day, including peak-period demand.

INPUT 02 — VERIFIED VEHICLE CAPACITY

Productive movements per vehicle under the intended route, load, and operating conditions.

INPUT 03 — OPERATIONAL RESERVE

Additional capacity justified by downtime risk, service requirements, and recovery needs.

A preliminary calculation is the required task volume divided by the achievable task volume per vehicle, rounded up to a whole vehicle. The result must then be checked against peak demand, traffic flow, charging arrangements, and redundancy requirements.

05. Validate Charging, Availability, and Recovery Capacity

Charging strategy affects the number of vehicles available for work at any given time. A fleet using opportunity charging may have a different availability profile from one using scheduled charging windows or battery replacement.

Ask the supplier to model charging around the actual shift pattern, duty cycle, battery configuration, and charging infrastructure. Confirm whether charging locations can be accessed without blocking high-priority routes.

Also define the recovery process for a vehicle that stops in an aisle, loses communication, or requires maintenance. A practical fleet plan should specify how blocked routes are handled, how tasks are reassigned, and whether the remaining vehicles can maintain essential warehouse operations.

06. What to Request From an AGV Forklift Supplier

To compare proposals fairly, give each supplier the same operating assumptions and request a documented capacity estimate. The proposal should explain both the recommended fleet size and the constraints that influence it.

  • Expected task volume by hour and shift.

  • Route distances and pickup/drop-off locations.

  • Vehicle cycle-time assumptions for loaded and unloaded travel.

  • Charging, maintenance, and availability assumptions.

  • Traffic-management logic and aisle-capacity constraints.

  • Expected performance during peak demand.

  • Results and acceptance criteria for a site-based proof of concept.

A credible recommendation should connect vehicle quantity to measurable operating requirements. If the supplier cannot explain the assumptions behind the proposed fleet size, the estimate is not yet sufficient for an investment decision.

Planning an AGV Forklift Fleet for Your Warehouse?

Share your pallet movement volume, operating shifts, travel distances, load specifications, and warehouse layout. ZCNest can help evaluate suitable forklift configurations and discuss the information needed for a realistic fleet-capacity assessment.

GET EXPERT CONSULTATION

💡Automation Insights & Guides

Share

Related resources

How to Select the Right Automated Forklift for Your Warehouse

03.23,2026

AGV Forklift Automation for Warehouse Operations Across Multiple Floors

11.11,2026

AGV Forklift Automation for Warehouse Inventory with Multiple Units of Measure

11.11,2026

AGV Forklift Automation for Warehouse Returns and Reusable Packaging

11.11,2026

AGV Forklift Automation for Warehouse Pallet Weighing and Weight Verification

11.11,2026